Evan’s Sociology Blog
Free vs. Fair Trade: A Case Study of the Coffee Industry
Although free trade and fair trade are often both considered virtues in American society, it is important to carefully consider the differences. Although free markets may help contribute to fair trade by allowing competition between companies, issues such as monopolies, human rights and environmental impact must be addressed by other means. The coffee industry has certainly been impacted by the fair-trade movement, but to what extent? We are all involved in the free market as consumers, and the choices we make on a daily basis as to which products we buy and which companies we support can have big implications for the quality of life in other countries, not just government regulation.
The fair-trade movement largely began in the 1960s as a reaction against business practices seen as unfair, largely stemming from student movements [1]. FINE (2001), which includes Fairtrade and the FLO (Fairtrade Licensing Organization) defines fair trade as the following:
1. To improve the livelihoods and well-being of producers by improving market access, strengthening producer organizations, paying a better price and providing continuity in the trading relationship.
2. To promote development opportunities for disadvantaged producers, especially women and indigenous people, and to protect children from exploitation in the production process.
3. To raise awareness among consumers of the negative effects on producers of international trade so that they exercise their purchasing power positively.
4. To set an example of partnership in trade through dialogue, transparency and respect.
5. To campaign for changes in the rules and practice of conventional international trade.
6. To protect human rights by promoting social justice, sound environmental practices and economic security. (p11) [2]
Although the goals of the fairtrade movement are certainly lofty, in practice many difficult questions have been raised about the FLO (Fairtrade Labeling Organization) and the extent to which they are actually able to benefit producers [3]. The FLO is one of the leading fair trade organizations dealing with licensing, and handles much of the licensing side of the WFTO (World Fair Trade Organization) which includes many smaller fair-trade organizations. Fair trade organizations are limited in scope, mostly focusing on agricultural products such as coffee, but some also deal with craft goods. Producers who join the FLO receive significant benefits. These include a guaranteed minimum price for their product regardless of market forces, and being able to receive a portion of the payment for their products ahead of time as credit. Additionally, some of the revenue from the fair trade program goes towards social programs, and workers benefit from workplace safety and minimum pay requirements, along with environmental protections such as limiting the chemicals used [4]. Certification for the fair trade program also comes with challenges for producers, such as forming collective groups, paying steep, recurring certification fees and finding a buyer who will purchase all or most of their product before receiving certification [3][4]. Since the higher revenue of fair-trade is desirable for farmers, models show that fair-trade programs will continue to grow until the increase in revenue balances out with the cost of certification [4]. This means that in the end, farmers will tend to not profit more from fair trade, but since many of the goals of fair trade are related to workers rights and environmental protections rather than increased profits for farmers, these goals can still be realized by free-trade programs as a way of improving quality of life in countries which produce everyday goods.
On the demand-side, Fairtrade (which includes the FLO) gets most of their income from licensing their brand name to wholesalers at a rate of 1.8%, half of which is spent on education and brand awareness which is unusually high for a charitable organization, whereas the other half is spent on the certification process [3]. The first part of the budget goes to raising awareness, including publishing articles, but these often contain outdated information suggesting that Fairtrade prices are higher than market prices, when often the opposite has been true [3]. Although Fairtrade focuses on removing the middlemen in the supply chain, a tough question for Fairtrade is why consumers should not purchase standard products instead and donate the difference to charity? After all, donating directly to a charity is tax-deductible in many countries including the US while buying Fairtrade products is not, and charities give in a more direct way rather than requiring certification fees from those it seeks to help. Perhaps fair trade allows people to feel that they are directly benefiting industries which matter to them, or allowing people to donate more than they would otherwise. Buying fair-trade products can easily slot into someone’s existing routine, getting a different brand from the same shelf for something like coffee which they would have purchased otherwise, whereas donating to a charity is more of a leap.
Some other difficulties with the fair-trade movement are scale and quality. In general, fair trade programs tend to target growers who are unsuccessful on the free market, which suggests lower quality. In addition, due to the minimum guaranteed prices regardless of quality, lower-grade coffee which would not fetch a high price on the free market is sold as fair-trade whereas better quality coffee from the same producer is sold on the open market [5]. This perverse incentive results in fair-trade coffee often being not only more expensive, but also of a lower quality than open market alternatives. It isn’t likely that someone would keep paying more for a worse product in the long run, so it isn’t necessarily a sustainable business model. The issue of scale is that there is only a limited demand for free-trade coffee, and so the more companies enter the fair-trade program, the smaller the fraction of coffee produced by members can be sold as fair-trade [4]. Additionally, only producers which can afford to join Fairtrade can benefit from it, which excludes farmers most in need of economic support. The minimum certification fee is around 1,530 GBP compared to an average annual income of 185 GBP in Kenya, which is certainly a very steep price for those who it claims to help [3].
Fair trade as a system is multi-faceted, with both moral and economic goals and realities. From a moral perspective, fair-trade can potentially improve quality of life by requiring work standards and environmental standards, but this is undermined by the steep certification fee levied on producers and the large fraction of income spent on advertising. From an economic perspective, Fairtrade is able to secure higher prices for producers, but again much of this goes back into certification fees, and the incentives for farmers to sell poor products as fairtrade coupled with higher prices is not a sustainable business model. I would recommend everyone to research the charitable organizations which they choose to support, not just through the literature which the organization itself puts out but also trusted, peer-reviewed sources which may be critical about the organization. It is easy to willingly misrepresent data, and the practical implications of a program may not be in-line with the stated goals. A better solution may be to purchase free-market coffee and donate the difference to a charity. This would potentially allow people to claim these donations as a tax deduction, while getting better quality products and contributing more directly towards charitable efforts of their choosing.
References
- Moore, G. (2004). The fair trade movement: Parameters, issues and future research: JBE JBE. Journal of Business Ethics, 53(1-2), 73-86. doi:http://services.lib.mtu.edu:2080/10.1023/B:BUSI.0000039400.57827.c3
- Redfern, A., & Snedker, P. (2002). Creating market opportunities for small enterprises : Experiences of the fair trade movement. St. Louis: Federal Reserve Bank of St Louis. Retrieved from https://services.lib.mtu.edu:5003/docview/1698579027?accountid=28041
- Booth, P., & Whetstone, L. (2009). Half a cheer for fair trade. Business Economist, 40(2), 10-21. Retrieved from https://services.lib.mtu.edu:5003/docview/743790461?accountid=2804
- Dragusanu, R., Giovannucci, D., & Nunn, N. (2014). The economics of fair trade. The Journal of Economic Perspectives, 28(3), 217-236. doi:http://services.lib.mtu.edu:2080/10.1257/jep.28.3.217
- Tj. (2018, July 12). 5 Unintended Fair Trade Coffee Problems. Retrieved April 27, 2020, from https://camanoislandcoffee.com/fair-trade-coffee-problems/
Class Inequality in The Big Short
“They knew the taxpayers would bail them out, they weren’t being stupid, they just didn’t care”
I decided to critique one of my favorite movies, The Big Short, which I would recommend to anyone who would like to see the 2008 financial crisis from a more human perspective rather than just from statistics, although it mostly focuses on traders and bankers rather than everyday people. Some of the major themes in this film are class inequality and how economic events affect people of different classes unequally, how people from a higher class can gamble while passing the risk on to lower classes, and the dehumanization and lack of morality within financial institutions.
The film is mostly written from the perspective of the people running four different investment funds, who each come to realize that the housing market is about to fail and decide to short sell on CDOs and mortgage bonds, even though nothing similar has happened since the Great Depression. The film covers a lot of the relevant terminology: short selling allows a trader to profit if the price of something tradeable goes down, and mortgage bonds are just a large number of mortgages which a bank owns bundled together to reduce the risk, so that if only a few mortgages fail because the homeowner isn’t able to pay the mortgage the whole bond won’t fail. The assumption that the entire financial industry had been making was that mortgage bonds and CDOs could not fail because many, many people would need to stop paying their mortgages for them to fail. Riskier and riskier mortgages were being put into mortgage bonds since so many were being bought, while CDOs are just bets that a mortgage will not fail. For every dollar worth of actual mortgages, there were about 20 dollars worth of CDOs, and so a huge part of the financial market was depending entirely on mortgages. As a result, when the percentage of people unable to pay their mortgages broke a certain threshold the bonds and CDOs began to fail and many large banks went bankrupt, ignoring traders who had short-sold and pretending that the bonds were still worth just as much as they were before until they could themselves short-sell to profit from the disaster.
The statistics are mind-boggling: In the US alone, 8 million people lost their jobs, 6 million lost their homes, and over 5 trillion dollars in savings, real-estate, retirement funds and pensions were lost. There was no accountability either, the banks were bailed out with taxpayer money and only one banker responsible went to prison, with the bailout money going into bonuses and lobbying.
Although the film claims that no significant reforms were passed, the Dodd-Frank act of 2010 was a huge reform which introduced much more oversight and accountability, while reducing the ability of the government to hand out bailouts. This is the most important aspect of class-inequality which the film focuses on, that when the banks win on a gamble they get to keep the profits, whereas when they lose a gamble the average taxpayers have to take the loss instead in the form of a bailout, meaning that the banks still win either way. Whether or not the Dodd-Frank act has really made the financial market more resilient is still to be seen, especially with the recent effects of COVID-19.
Another aspect of class inequality which is seen in the film is how people are dehumanized by trading. Mortgage bonds are just seen as something to be bought and sold when really people’s homes are at stake, and even some of the traders who were betting that mortgage bonds would fail were celebrating the collapse without really realizing the bigger picture that people would be out on the street because of the whole situation. On a similar note the film also explains how the blame was shifted away from the source, risky and greedy investments by banks, and towards convenient scapegoats like immigrants and the poor as being the cause of the financial meltdown. This is reminiscent of the book Evicted, where renters aren’t willing to work with each other to collectively bargain for a better situation and instead blame each other.
While The Big Short is not a cheerful film, it does provide a very interesting perspective on the financial crisis and can help make financial terminology more approachable, as a lot of terms are explained very well to allow people to have a better understanding of the market that affects their everyday lives.
MTU Voter Participation in 2016
As participants in a democracy, voting and other forms of civic engagement are vital for influencing policies which affect our everyday lives, as elected officials only need to gain the support of those who vote. Universities in general showed a lower rate of voter participation in 2016 than the overall voting-age public at 50.4% compared to 61.4%, with MTU showing an even lower rate at only 34.3% [1][2]. This dramatic difference between MTU and other institutions may be the result of numerous factors, such as demographic differences, university culture, legislation and student living situations. The school administration could be doing more to promote voting and civic engagement, such as bringing in guest speakers and having more students take courses which involve critical thinking about politics.
As a small STEM focused university, MTU has a different demographic distribution than the average university. Many of these differences also correlate to lower voter participation rates. Across all universities, the percentage of male students is 44%, whereas 73% of MTU students in 2016 were male [2][3]. Male students generally vote at a lower rate than female students, at a rate of only 44.4% compared to 51.6% for female students all NSLVE institutions, and 26.1% compared to 35.8% for females at MTU [4]. Engineering and computer science majors also showed lower participation rates, and comprised 74.5% of enrolled students at MTU at only 27.3% and 23.9% voter participation rates respectively. A similar trend was seen at UMich, showing only 32.7% and 33.1% participation rates in these fields compared to 44.7% for UMich overall [5]. Compared to MTU, UMich has similarities as another highly-rated Michigan public university, but has a much larger focus on liberal arts in addition to STEM with only 23.4% of students in engineering and computer science, along with a much lower percentage of male students at 50.2%. These demographic differences correlate to a higher voting rate of 44.7% at UMich compared to 34.3% at MTU.
Cultural differences and the way that MTU students are socialized may also help explain this disparity. In general, MTU students seem to be less politically involved than UMich students, with fewer high-profile political actions. For example, Hash Bash is held on the UMich campus each year, with attendance in 2019 exceeding 10,000, and in the same year there was a climate protest blocking Board of Regents members from leaving a meeting for nearly 45 minutes [6][7]. At MTU in 2019, there was a climate protest drawing only 51 participants [8]. These political actions may result in students feeling more connected to national movements and being more politically active, so the lack of such activities on the MTU campus may point to less political involvement. While voter registration drives are held at MTU, they are small-scale events and not held as a high priority by the administration. On the other hand, at UMich the Ginsberg center has the specific goal of improving democratic engagement [9]. The STEM focus of coursework at MTU also does not involve as much critical thinking about politics and social issues as a liberal arts focus at schools such as UMich. These courses may encourage students to think more about politics and form their own political beliefs, promoting political involvement.
The geographic isolation of MTU compared to other universities is also a likely factor in low voter participation rates. Most students are not from the surrounding area, resulting in 65% of voting done by absentee ballot, with only 29.3% in-person for the 2016 election [2]. In contrast, only 35.2% of UMich students voted by absentee ballot and 49.4% voted in-person, as a school situated in a more populated area [5]. In 2016, there was a requirement for first-time Michigan voters who had registered by mail to vote in person, which made many students living far from home ineligible for an absentee ballot. With election day being Tuesday, November 8th during regular classes, students would have had difficulty voting in person. With the passage of 2018 Proposal 3, this requirement has been removed and it is now possible to vote absentee without any reason, which will likely have a positive impact on student participation in the 2020 election [10].
There were a myriad of factors leading to low voter participation at MTU in the 2016 election, from demographic makeup to campus culture, and from coursework to legislation impacting first-time voters. The administration at MTU could do more by encouraging voter registration and political thinking, such as having guest speakers or raising more awareness about voting and voter registration. Additionally, courses which encourage political thinking may increase voter participation at MTU. Increasing voter participation at MTU is essential for ensuring that students can have an impact on the policies which matter to them.
Works Cited:
[1] US Census Bureau. “Voting in America: A Look at the 2016 Presidential Election.” The United States Census Bureau, The United States Census Bureau, 10 May 2017, www.census.gov/newsroom/blogs/random-samplings/2017/05/voting_in_america.html.
[2] Tisch, Johnathan M. 2012 & 2016 Campus Report, Student Voting Rates for Michigan Technological University.
[3] McCubbin, James. “Student Demographics in Higher Education.” Student Demographics in Higher Education, blog.campus.app/student-demographics-in-higher-education.
[4] Tisch, Johnathan M. Democracy Counts A Report on U.S. College and University Student Voting.
[5] Tisch, Johnathan M. 2012 & 2016 Campus Report, Student Voting Rates for University of Michigan – Ann Arbor.
[6] Stanton, Ryan. “Biggest Hash Bash Ever: With Pot Legalized, Rally Draws Huge Crowd in Ann Arbor.” Mlive, 7 Apr. 2019, www.mlive.com/news/ann-arbor/2019/04/biggest-hash-bash-ever-with-pot-legalized-rally-draws-huge-crowd-in-ann-arbor.html.
[7] Slagter, Martin. “Climate Protesters Block University of Michigan Execs from Exiting Meeting.” Mlive, 7 Dec. 2019, www.mlive.com/news/ann-arbor/2019/12/climate-protesters-block-university-of-michigan-execs-from-exiting-meeting.html.
[8] “Facebook.” Keweenaw Climate March & Sail, www.facebook.com/events/516068132527710/.
[9] “The Edward Ginsberg Center for Community Service and Learning.” Civic and Democratic Engagement: A Brief Overview | The Edward Ginsberg Center for Community Service and Learning, ginsberg.umich.edu/article/civic-and-democratic-engagement-brief-overview.
[10] New Rights for Michigan Voters, www.wcs.k12.mi.us/Departments/Public-Relations/Community/docs/Voters-Information.pdf.
Learning to Learn: How I Was Socialized Into a Student
As members of society, we each hold a number of statuses which define us to both others and ourselves, with related “roles” that tells us how to express this status. One status that I strongly identify with is that of a student, as I have spent most of my life so far as a student of one kind or another. Although I was not born as a student, many of my life experiences have not only persuaded me to be a student, but have also taught me how to fulfill the role of being a student in our society through the process of socialization.
Beginning from birth, we are socialized by our parents to learn the roles we are supposed to fill through by both persuasion and example. As a child my parents would often encourage me to do things which better fulfill the role of a student, such as showing up to school on time, getting better grades and completing homework. I also attended preschool because of my parents, as it is not otherwise required by the government. Both of my parents attended college and worked jobs pertaining to their degrees, my mother attaining a Master’s in early childhood development and running a daycare, and my father attaining an Associate’s in computer science and becoming a programmer, along with my grandfather being an engineer in the automotive industry with a PhD in physics. Starting from a young age I considered my parents to be the “template” of what it means to be an adult, so I believed that I would need to go to college as an adult which requires learning the role of a student well.
The school system itself had a large part in socializing me into a student. Beginning in preschool, students learn the basic norms of being a student such as being away from family, listening to the teacher and participating in activities and assignments. Starting in 1st grade, I learned more student norms, such as being to class on time, not talking over the teacher and leaving when the bell rings. I also learned student values in this way, such as good grades, consistent attendance and avoiding physical conflict.
Although the norms of my K-12 education remained largely the same, they became largely different by the time I reached college. While 1st grade students are led to their next class by a teacher, in later grades students are trusted to find their way to classes on their own. Similarly, students are also allowed to pick increasingly more of their classes, from only a few classes in middle school to choosing a major and completing registration individually in college. Now, as a college student even attendance is not considered mandatory in many classes and there is no longer a bell to signal the beginning and end of class. Overall, it seems that up through middle school students are socialized to have less and less agency, whereas in high school and college students are expected to be increasingly independent. Rather than completing simple, well structured assignments, my classes increasingly expect me to determine the best way to complete an assignment myself. This open-endedness allows assignments to more closely mirror actual problems that someone may solve in a professional setting, where expectations aren’t always clearly laid out. Although I still consider myself a student, college seems to be undoing much of the socialization which previously shaped me into a student.
While some of the norms associated with being a student are largely exclusive to school, such as arriving before a bell and being dismissed by a bell, they do have implications in the workplace. I believe that the new norms and values which I have been learning as a college student have the goal of socializing me to the role of a worker, where arriving on time is important but there is no bell, where providing good, quality work is important but there is no assignment sheet or answer box. From a functionalist perspective, school establishes norms which provide the framework of a bureaucracy, where people acknowledge a hierarchy of supervisors giving assignments and workers completing these assignments within a limited span of time to certain standards of quality. This common set of expectations which people hold as to how work is supposed to be done allows people to work together effectively.
Overall, I would say that most of the socialization that goes into making a student establishes norms which are not unique to being a student, but also apply to the workplace. By learning how to be a worker, I have also learned much of what defines an employee, which is a positive for future employment. School serves a functional purpose in defining the relationships which form a company and the manner in which work is meant to be done.
Industry Shifts in Michigan’s Upper Peninsula
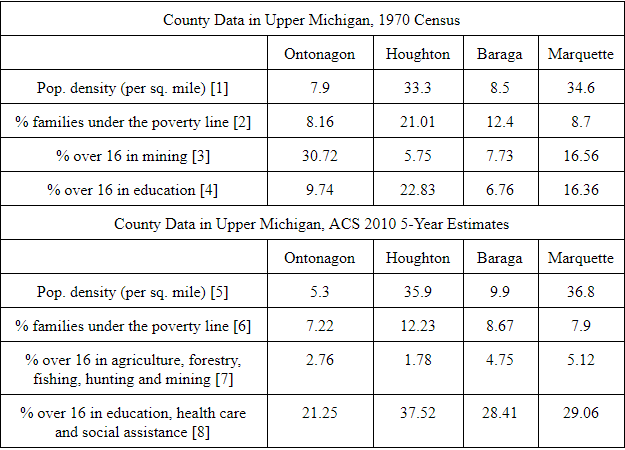
The story of Michigan’s upper peninsula shows considerable social and economic change in a short period of time. By comparing four counties, Ontonagon, Houghton, Baraga and Marquette leading from west to east, it is possible to gain some insight into these changes. All statistics were collected from the U.S. Census and ACS, and tabulated at the end of the article.
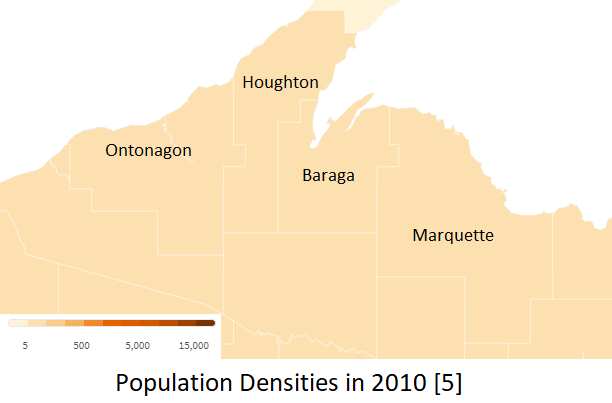
In 1970, population densities in this region were generally low and consistent with each other, ranging from only 7.9/sq.mi in Ontonagon to 34.6 in Marquette. Mining was a dominant industry in Ontonagon and Marquette, whereas education was dominant in Houghton and Marquette as college towns. Poverty was most prevalent in Houghton, with a full 21% of families under the poverty line.

Moving into 2010, the percentage of miners in this area has dropped sharply, especially in Ontonagon, where the percentage of people over 16 in mining has dropped from 31% to only 3% for mining, forestry and agriculture combined. The percentage of people in education, healthcare and social assistance is now higher than the percentage in healthcare in 1970, but due to different categories it is hard to compare these two figures. Population density has changed considerably, with a slight increase in Houghton, Baraga and Marquette but a considerable decrease in Ontonagon. The percentage of households under the poverty line has decreased the most in Houghton, which is still the highest at 12%.
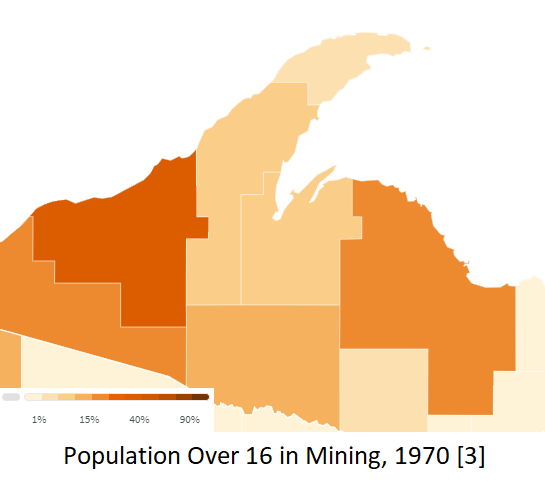
The decline of the mining industry appears to be a major factor in these social changes, as it would happen regardless of other social changes. The mineral resources in an area are not dependent on how many people live there, and so regardless of how many people live there a large mining industry would start up. A drop in population would not result in a drop in mineral resources, but a drop in mineral resources may result in a drop in population. This would be opposed to other industries like healthcare and education, which serve the population and may vary as the population changes. Ontonagon, which once had a very large mining industry, has now had a large decrease in both the industry and the population. It is likely that the decrease in the mining industry is what caused this decrease in population and not the other way around, since the mines in the area may have been fully extracted. Houghton, which once only had a very small percentage of the population in mining, has seen a slight increase in population density and a greater decrease in poverty than other counties, as a decrease in mining industry would not have as much of an effect. Marquette, which once had a nearly equal percentage of workers in mining and education, now has more workers in education and social work than in mining and forestry. A slight decrease in families under the poverty line and a slight increase in population is also seen, much like Houghton.
What Houghton and Marquette hold in common is that both counties have universities, which may help bring in money from other parts of the state and the country. Not only do universities get federal and state funding, they also receive tuition from attending students, much of which would be spent in the surrounding community on goods and services. Students may also spend money in the community, further stimulating the local economy. According to MTU, enrollment increased from 3,400 to over 7,600 from 1965 to 1979, which may make it one of the main industries in the region [9]. NMU has had even greater enrollment numbers, over 9,400 in 2010 [10]. The size of the university would also seem to be largely independent of other social forces in the region, as many students do not come from the same community that the university is situated within. The changes in Baraga are interesting, as it has seen both an increase in population and a decrease in families in poverty while not containing a university itself. Further work may explore what factors have had an effect in this county, or exploring more localized data such as rates of families under the poverty line in specific county subdivisions and specific mine closures.
Works Cited
[1]U.S. Census Bureau. “Population Density, 1970.” Social Explorer. Web. Jan 30 2020.
[2]U.S. Census Bureau. “Families Below Poverty Level, 1970.” Social Explorer. Web. Jan 30 2020.
[3]U.S. Census Bureau. “Employed Population 16+ Mining, 1970.” Social Explorer. Web. Jan 30 2020.
[4]U.S. Census Bureau. “Employed Population 16+ Industry: Elementary and secondary schools and colleges, 1970.” Social Explorer. Web. Jan 30 2020.
[5]U.S. Census Bureau. “Population Density, 2010.” Social Explorer. Web. Jan 30 2020.
[6]U.S. Census Bureau. “Families: Income in 2010 Below Poverty Line, 2010.” Social Explorer. Web. Jan 30 2020.
[7]U.S. Census Bureau. “Total Employed Civilian Population 16 Years and Over: Agriculture, Forestry, Fishing and Hunting, and Mining, 2010.” Social Explorer. Web. Jan 30 2020.
[8]U.S. Census Bureau. “Total Employed Civilian Population 16 Years and Over: Educational Services, and Health Care and Social Assistance, 2010.” Social Explorer. Web. Jan 30 2020.
[9] Michigan Technological University. “Michigan Tech History.” Web. Jan 30 2020. URL: https://www.mtu.edu/about/history/
[10] Northern Michigan University. “Student Profiles.” Web. Jan 30 2020. URL: https://www.nmu.edu/institutionalresearch/student-profiles
Follow My Blog
Get new content delivered directly to your inbox.
